In the third quarter of 2026 (1/7–30/9), the typical agency or marketing Facebook Page in Vietnam earned 6.5 engagements per post (median). The middle half of Pages ranged from 2 to 19.25, and scaled by audience the median was 0.46 engagements per 1K followers. The figures come from public data on 12 Pages and 425 posts tracked on Fanpage Insight.
The sector has a distinctive engagement mix: shares made up 9.95% of engagement, against 4.9% for comments. Multi-photo albums reached 1.2x the same Page's single-photo median (ahead on 67% of 6 Pages). On scheduling, Thursday stood out at 1.36x the Page's own median, a pattern that held on 70% of 10 Pages.
This is a quarterly reference sheet for agencies, consultancies and marketing communities. The Q4 2026 edition follows in early 2027.
01 · Engagement standardWhat normal engagement looks like for an agency Page
The 6.5 figure is a median of medians: each Page's own median engagement per post is computed first, then the median is taken across the 12 Pages. The middle half runs from 2 to 19.25, which means a quarter of Pages had a median of 2 engagements per post or less.
Shares made up 9.95% and comments 4.9% of a typical Page's engagement. For a sector that sells expertise, shares signal content that practitioners pass on to colleagues. On cadence, the 6 Pages with full-quarter data posted a median of 2.21 times a week.
Engagement standards by industry, 2026 data
Page medians, 1/1–18/11/2026. *Finance has only 3 Pages; read with caution.
Show data table
| Industry | Pages | Median engagement/post | Per 1K followers | Comments (%) | Shares (%) |
|---|---|---|---|---|---|
| Real Estate | 27 | 10 | 2.31 | 0.8 | 2.4 |
| Software & SaaS | 12 | 5 | 0.23 | 9.45 | 7.55 |
| Agencies & Marketing | 12 | 8 | 0.42 | 5.8 | 12.05 |
| Education | 11 | 21 | 0.64 | 16 | 10.2 |
| Media & Entertainment | 26 | 117.25 | 0.32 | 3.3 | 2.05 |
| Finance & Fintech* | 3 | 16 | 0.16 | 2.5 | 1.5 |
| Consumer & Health | 23 | 105 | 0.14 | 9.3 | 4.1 |
| Auto, Energy & Industry | 5 | 89 | 0.75 | 5.7 | 4.0 |
Source: public data from 119 Facebook Pages tracked on Fanpage Insight
Across the 2026 data, agencies and marketing have low engagement per post (8) but the highest share rate of any industry, 12.05%. Engagement per 1K followers (0.42) is mid-table: above software and consumer, below education and real estate. Q3's 0.46 sits close to the full-year level.
How to use it: above 6.5 engagements per post you are ahead of half the sector; above 19.25 you are in the top quarter. Track shares on their own: for agencies they are the clearest sign that content has professional value.
02 · FormatsFormats: albums are dependable, video looks promising on a small sample
Single photos account for 40.9% of posts, multi-photo albums 20.7%, Reels 15.8% and text-only posts 11.1%, a much higher text share than other sectors. Video makes up 7.8% and link posts just 1.9%.
Format performance vs the same Page's single photos
Median across Pages; each Page compared with its own single-photo posts
Source: public data from 12 agency & marketing Facebook Pages tracked on Fanpage Insight, Q3 2026
Albums are the most reliable result: 1.2x single photos, ahead on 67% of 6 Pages. Video reached 1.54x and won on 75%, but only 4 Pages had enough data to compare, so read it with caution; Reels (1.04x) also rest on 4 Pages. Text-only posts, despite being 11.1% of output, reached only 0.66x single photos across 3 Pages.
The teardowns point the same way. ACCESSTRADEVN saw a curiosity-driven teaser video beat every programme announcement. AdsPlus found Meta workshops and expert Reels drive engagement while text-only posts lag. At the other end, Zafago Agency has strong TikTok Shop expertise, but static images keep its engagement near zero.
What to do: turn long text posts and single-image expert posts into multi-photo carousels. Test short video for events and teasers, and measure on your own Page before raising its share of the mix.
03 · TimingTiming: Thursdays and evenings stand out
Engagement by weekday vs the same Page's median
Vietnam time (GMT+7)
Source: public data from 12 agency & marketing Facebook Pages tracked on Fanpage Insight, Q3 2026
Thursday reached 1.36x the Page's own median and held on 70% of 10 Pages, the clearest timing result in the sector. Saturday reached 1.19x, ahead on 75% of 8 Pages. The remaining days hover around 1x with no meaningful difference.
By time of day, 18:00–21:00 reached 1.2x (won on 56% of 9 Pages), 12:00–15:00 1.12x (won on 50% of 6 Pages) and 15:00–18:00 1.05x. The 09:00–12:00 and 21:00–24:00 blocks sat at 1x. These gaps are small, and they are correlations, not causal effects; they may reflect the kind of content typically posted at each time.
What to do: try placing your most important expert post on Thursday or Saturday, in the 18:00–21:00 window, and compare with your own median after a few weeks.
See these numbers for your own Page
Paste any Page URL, even a competitor's. No admin access needed, report in minutes.
04 · Standout PagesThe agency Pages that stood out this quarter
Median engagement per post, all 12 Pages
Q3 2026; dashed line is the sector median
Show data table
| Page | Median engagement |
|---|---|
| PMAX | 32 |
| MarketingTrips | 27 |
| Bracom Agency | 20 |
| AdsPlus | 17 |
| MMA Vietnam | 13 |
| SEONGON | 8 |
| ACCESSTRADEVN | 5 |
| Zafago Digital Growth Partner | 2 |
| Brandsketer Việt Nam | 2 |
| Navee | 2 |
| Zafago E-commerce | 1 |
| Zafago Agency | 1 |
Source: public data from 12 agency & marketing Facebook Pages tracked on Fanpage Insight, Q3 2026
PMAX: the most efficient Page with 10K+ followers
PMAX (17,518 followers) posted a median of 32 engagements per post and 1.83 per 1K followers at 3.35 posts a week; shares were 11.2% of its engagement.
Its teardown found company-culture posts get shared widely while expert content draws few comments. An agency's people are content in their own right.
SEONGON: the highest comment share among the leaders
Comments made up 30.6% of SEONGON's engagement, against a sector median of 4.9%. One video on 30/9 drew 522 comments.
Its teardown found AI webinars and playbooks outperform partnership and award news. Content that offers something to take away (a guide, a session) earns comments.
ACCESSTRADEVN: the largest Page, carried by one video
With 147,479 followers, ACCESSTRADEVN had a median of 5 engagements per post (0.03 per 1K followers), yet one teaser video earned 7,033 engagements.
One breakout post does not move the baseline. The teardown found the curiosity-driven teaser far outperformed programme announcements.
Other Pages worth reading: MarketingTrips (66,912 followers, shares at 22.4%) gets company news shared but sparks almost no discussion; MMA Vietnam draws engagement with AI and flagship event posts; Bracom Agency (2.2 per 1K followers) sees hiring and award posts beat project showcases. The three Zafago Pages (Zafago Digital, Zafago E-commerce, Zafago Agency) publish in-depth expertise but have medians of only 1–2 engagements per post, and Brandsketer Vietnam finds only SME-focused content gets a response.
What to do: if your Page has fewer than 10K followers, compare with Bracom Agency and Brandsketer; between 10K and 30K, PMAX, AdsPlus, MMA Vietnam and SEONGON are the right reference points.
05 · Top postsThe five most-engaged posts of the quarter
Three of the top five posts were videos and two were multi-photo albums. ACCESSTRADEVN's leader (7,033 engagements) was almost all reactions, while SEONGON's video (764 engagements) drew 522 comments: two very different kinds of success.

ACCESSTRADEVN · 2026-09-29 · Video
Event teaser video; only 8 comments and 11 shares, almost entirely reactions.
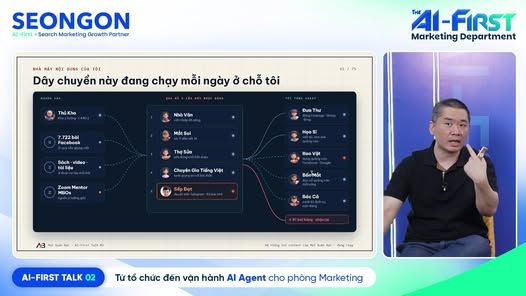
SEONGON · 2026-09-30 · Video
A video with 522 comments, by far the most comments in the top five.
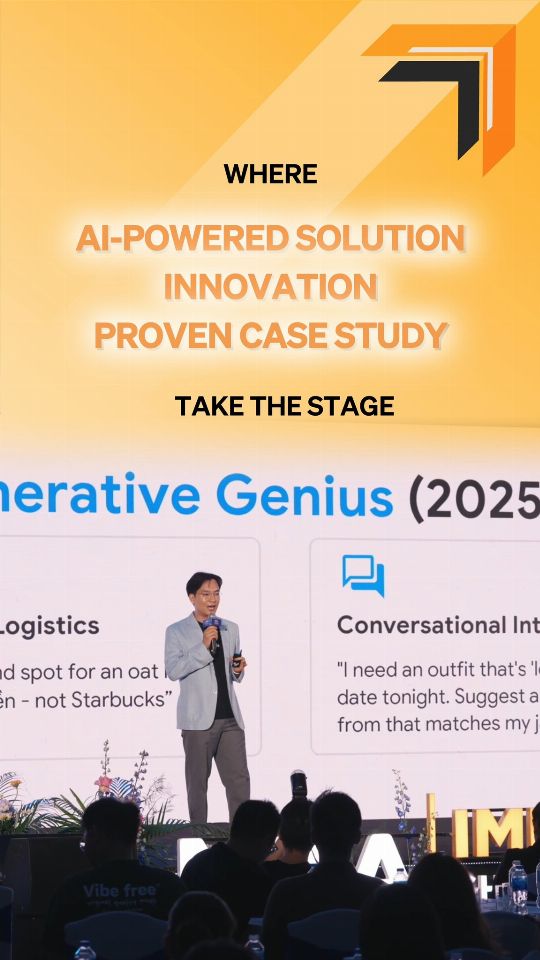
MMA Vietnam · 2026-09-10 · Video
Video with 1 comment and 1 share.

SEONGON · 2026-08-06 · Multi-photo album
Multi-photo album with 29 shares.

AdsPlus · 2026-09-25 · Multi-photo album
Multi-photo album with 1 comment and 1 share.
No single photo made the top five, even though single photos are 40.9% of the sector's posts.
06 · What to doWhat agency marketers should do in Q4
- Compare your Page with the 6.5 median and the 2–19.25 middle band.
- Move text-only posts (0.66x, 3 Pages) and single-image expert posts into multi-photo albums (1.2x, ahead on 67%).
- Test teaser video for events; the 1.54x signal rests on 4 Pages, so validate it on your own Page.
- Put key posts on Thursday (1.36x, ahead on 70% of 10 Pages).
- Track shares (median 9.95%) and comments as two separate metrics.
- Use questions in captions when you want discussion; see questions in captions.
07 · FAQFrequently asked questions
What is good engagement for an agency Facebook Page?
In Q3 2026 the sector median was 6.5 engagements per post, with the middle half between 2 and 19.25. Above 19.25 puts a Page in the top quarter.
What day should agencies post on Facebook?
Thursday gave the clearest result this quarter: 1.36x the Page's own median, ahead on 70% of 10 Pages. Saturday reached 1.19x. These are correlations, so test them on your own Page.
Why does agency expert content get so little engagement?
The Zafago and PMAX teardowns both found that deep expert content struggles to start discussion. Posts with something to take away, such as webinars and playbooks (SEONGON), or posts about people and culture (PMAX), did better.
When will the Q4 2026 benchmarks be published?
The Q4 2026 edition is planned for early 2027, using the same method so the two quarters can be compared.
Methodology & data sources
Based on public data from 12 agency and marketing Facebook Pages tracked on Fanpage Insight, covering 425 posts published 1/7–30/9/2026. Engagement is reactions plus comments plus shares as collected; follower counts are taken at collection time. Format and timing effects are measured within each Page (against its own single-photo posts or its own median) and summarised as the median across Pages. Times are Vietnam time (GMT+7). Posting frequency uses only the 6 Pages with full-quarter data. Results based on fewer than 5 Pages are flagged and should be read with caution. All findings are correlations, not causal effects.
- Data
- 12 Pages, 425 posts, 329,177 followers in total
- Window
- 1/7–30/9/2026 (Q3 2026)
- Metrics
- Page medians: engagement per post, per 1K followers, comment and share share, posts per week
- Industry context
- 119 Pages, 1/1–18/11/2026